
Surface and interfacial tension are fundamental thermodynamic properties of fluid interfaces. They express the free-energy penalty associated with the creation of interfacial area and, consequently, participate in the selection of drop and bubble shape, capillary pressure, wetting, dispersion formation, coalescence, atomization, coating and a wide range of transport processes. Although surface tension is frequently introduced as a tangential force acting along a liquid boundary, its rigorous description is thermodynamic: for a reversible increase in interfacial area at constant temperature, pressure and composition, the interfacial tension is the corresponding derivative of Gibbs free energy with respect to area. The mechanical and thermodynamic descriptions are mutually consistent and are connected experimentally through the curvature of interfaces. [P1, P2, 1, 4, 6]
For a pure liquid at equilibrium, surface tension is a material property determined primarily by molecular interactions and temperature. Multicomponent systems are more complex because the interface can possess a composition that differs markedly from that of the adjacent bulk phases. Amphiphilic molecules, proteins, polymers, lipids and even nominally minor impurities may accumulate at an interface. The resulting adsorption lowers the interfacial free energy and therefore changes the measured tension. Gibbs adsorption thermodynamics provides the general relationship between changes in surface tension and the chemical potentials of components, while adsorption isotherms provide model-dependent connections interrelations between bulk concentration, interfacial coverage and surface pressure. [P1, P4, 1, 4, 6]
The equilibrium state is only one the limiting case. When a new interface is formed, adsorption requires finite time. Molecules must be transported from the bulk, cross a subsurface region, enter the interfacial layer, adsorb, and, in many systems, reorganize after adsorption. As a result, the measured surface or interfacial tension depends on interfacial age. This dynamic tension is not an experimental nuisance; it is often the physically relevant property. Bubble formation, spraying, inkjet printing, foaming and high-speed coating can create and destroy interfaces on timescales far shorter than those required for reaching the equilibrium state of adsorption. [P1, P4, 6]
A scientifically defensible tensiometric measurement therefore requires more than a numerical value of γ. One must define the liquid phases, temperature, composition, preparation history, interfacial age, instrument geometry and measurement principle. Profile analysis tensiometry evaluates the complete drop or bubble contour using the Young–Laplace equation and provides a highly versatile route to equilibrium and dynamic measurements, including liquid–liquid interfaces and controlled oscillations. Maximum bubble pressure tensiometry extends dynamic characterization toward very short surface ages. Force, capillary and drop-volume methods provide complementary information in other experimental windows. Taken together, these methods make surface and interfacial tension a powerful observable for linking molecular adsorption to macroscopic interface formation. [P2, P3, 2, 3, 4]
What the measured quantity actually represents
γ = (∂G / ∂A)T,p,nᵢ
Surface or interfacial tension is the reversible Gibbs free-energy cost of creating unit interfacial area under defined thermodynamic constraints. [P1, 1, 4, 6]
liquid/gas · liquid/liquid
Surface tension normally denotes a liquid–gas interface; interfacial tension is the corresponding quantity at an interface between two condensed liquid phases. [P1]
µs → hours
For adsorption-active systems γ is generally a function of interfacial age. No single technique spans the complete experimentally relevant time domain. [P1, P4, 6]
Δp = γ(1/R₁ + 1/R₂)
The Young–Laplace relation connects pressure difference, curvature and interfacial tension and forms the basis of several modern tensiometric methods. [P2, P3, 2, 3, 4]
Surface tension is simultaneously a thermodynamic, molecular and mechanical property
A complete interpretation requires all three viewpoints.
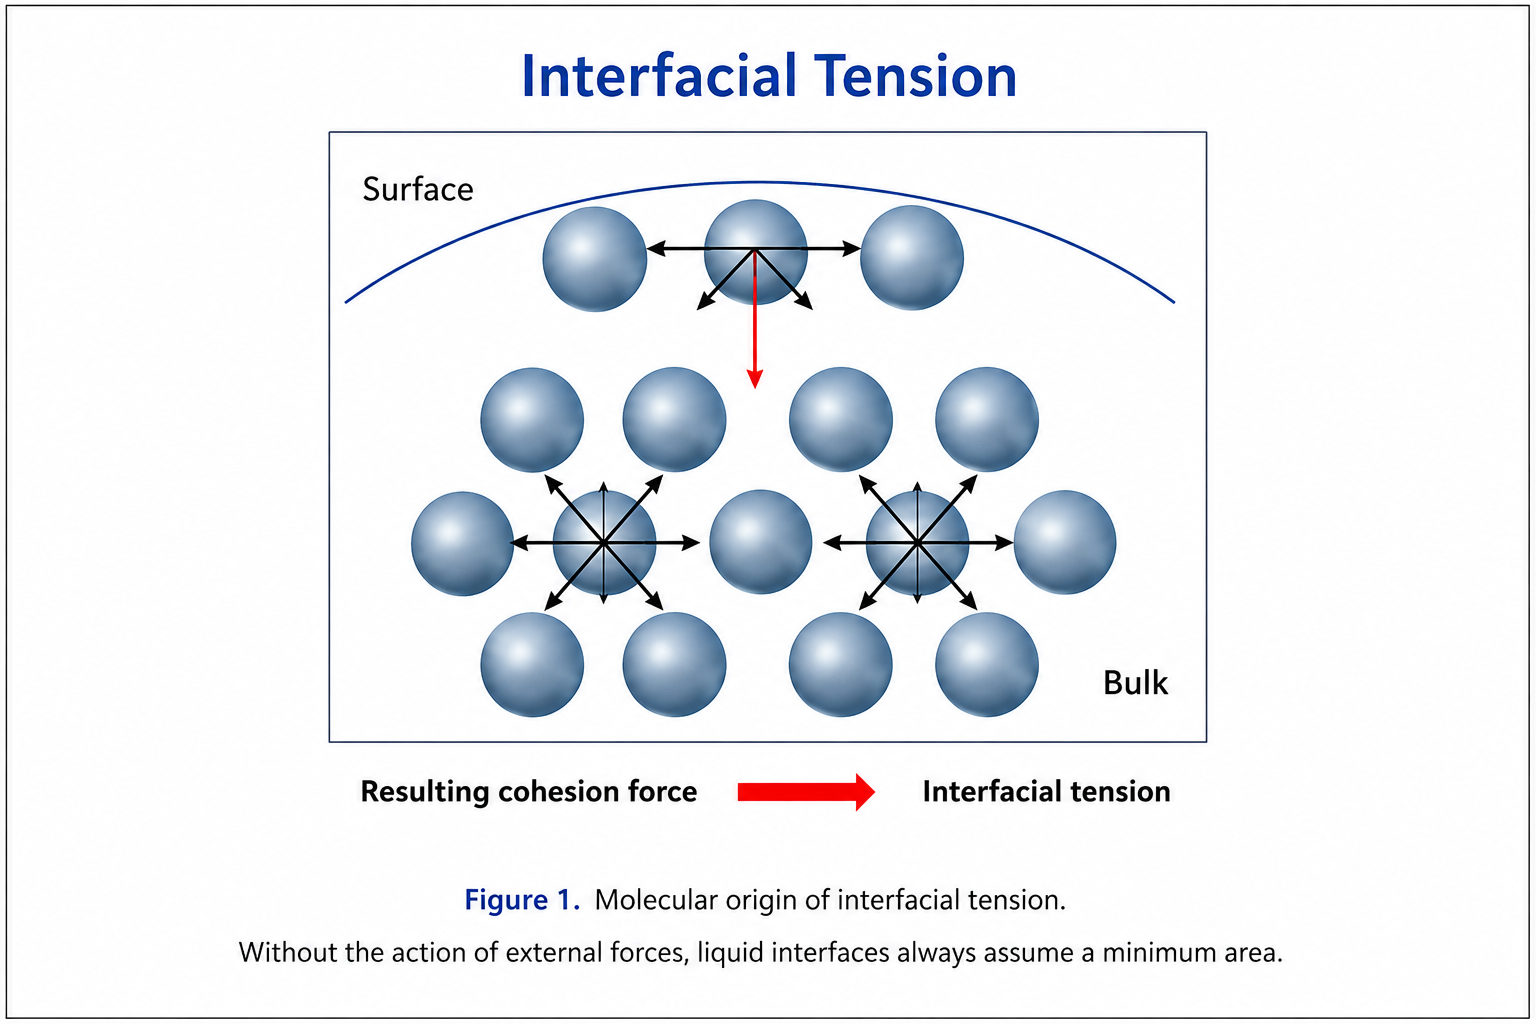
Any macroscopic sample of liquid contains molecules in energetically different environments. A molecule deep in a homogeneous phase is surrounded by neighboring molecules in all spatial directions. A molecule located in the interfacial region experiences an anisotropic environment because the composition and density on one side differ from those on the other. The interfacial region therefore possesses an excess free energy relative to the corresponding amounts of bulk material. The system reduces this energetic contribution by minimizing interfacial area whenever external constraints do not prevent it. This tendency explains why sufficiently small free drops and bubbles approach spherical shapes: at fixed volume, the sphere has the minimum possible area. [P1, P2, 1, 4, 6]
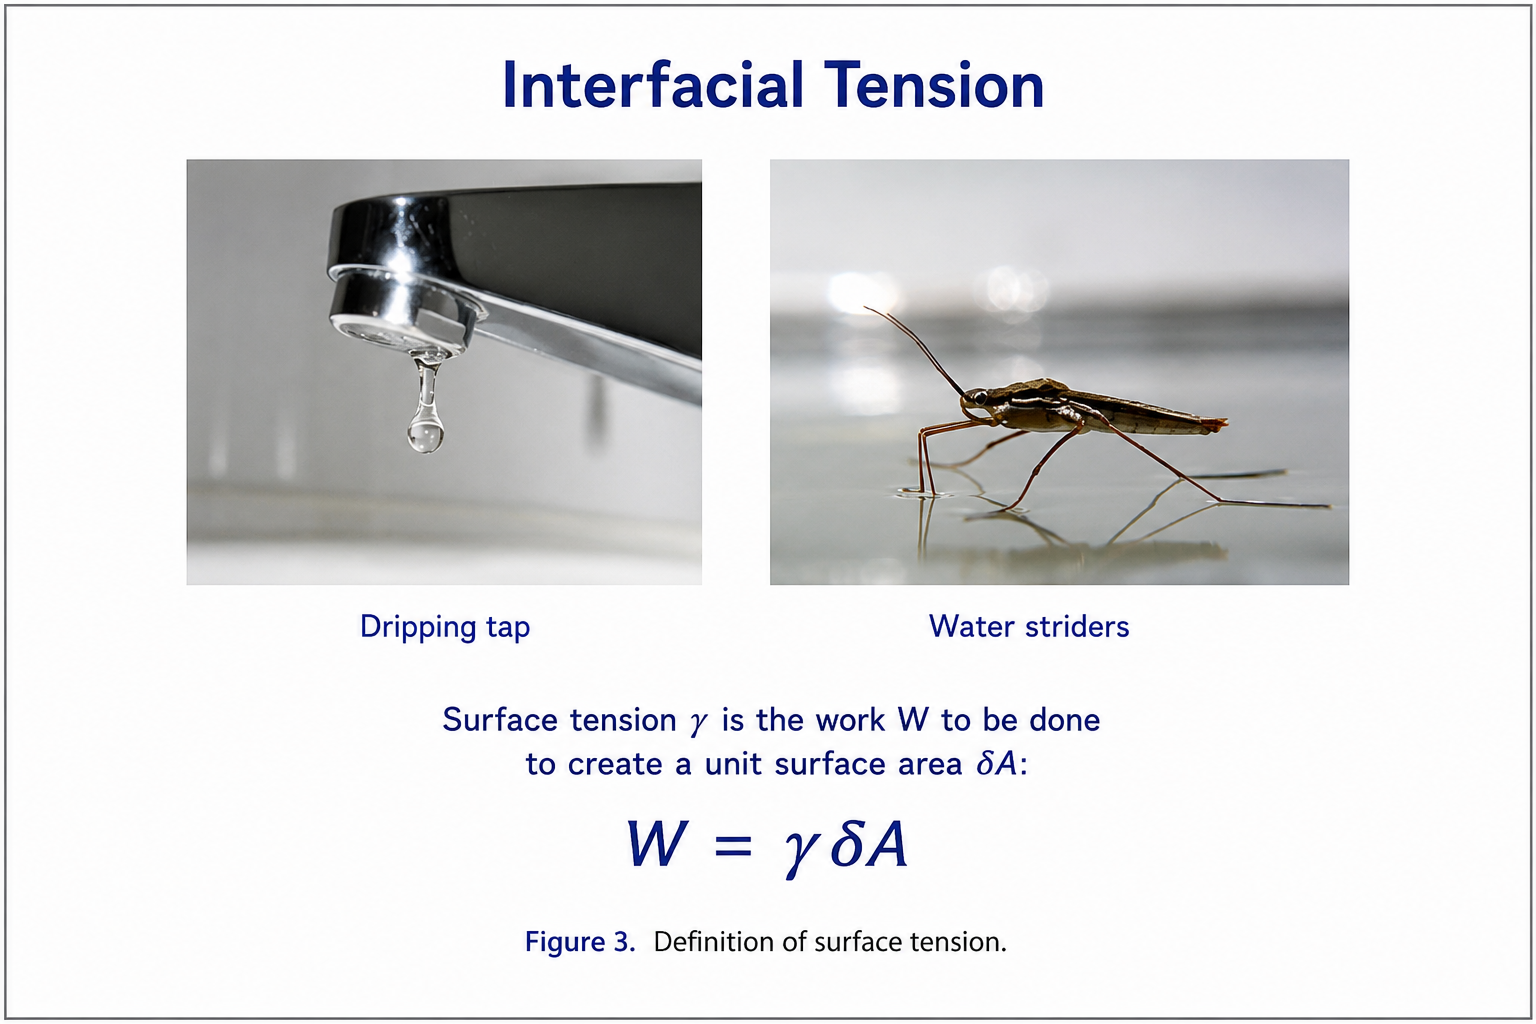
The familiar language of a contractile “skin” is useful at an introductory level but should not be interpreted literally. A liquid interface is not a separate elastic membrane in the ordinary material sense. Surface tension is instead an excess free energy per unit area and, equivalently, a force per unit length acting tangentially within the interface. Both descriptions have the same SI dimension, N m⁻¹ = J m⁻². Tensiometry normally reports mN m⁻¹, numerically identical to mJ m⁻². In the past, people used instead dyn cm-1, which identical to mN m-1. [P1, 1, 4, 6]
The terminology depends on the adjacent phases. “Surface tension” is generally reserved for a liquid in contact with a gas, most commonly air or a controlled vapor phase. “Interfacial tension” is the broader expression and is particularly used for liquid–liquid boundaries such as water–oil interfaces. The thermodynamic formalism is the same, but liquid–liquid systems may introduce additional complexity: both phases can be partially mutually soluble in each other and can contain surface-active solutes (impurities), the solute can partition between phases, the density difference may be small, and adsorption can deplete finite drops or bulk reservoirs. [P1, P4, 1, 4, 6]
A measured tension belongs to an interfacial state, not merely to a liquid name. Reporting “the surface tension of a surfactant solution” is incomplete unless concentration, temperature and interfacial age are known. For multicomponent systems, preparation history, impurities and the geometry-dependent relation between interfacial area and available bulk volume may also matter. [P1, P4, 6]
From equilibrium property to interfacial observable
For a pure liquid under equilibrium conditions, surface tension often behaves sufficiently reproducibley to be treated as a tabulated property. The situation changes when surface active components are present. Adsorption enriches one or more components in the interfacial layer and changes its free energy. At equilibrium, the interfacial composition is linked to bulk chemical potentials. During interface formation, however, the interfacial composition evolves with time. Consequently, γ becomes an experimentally accessible indicator of adsorption and transport. [P1, P4, 1, 4, 6]
This is why tensiometry extends far beyond quality control of pure liquids. A time-resolved γ(t) curve contains information about how rapidly an interface is populated; an equilibrium γ(c) isotherm reflects the concentration dependence of adsorption; controlled area oscillations probe the mechanical response of an adsorption layer. The same basic observable can therefore connect thermodynamics, kinetics and interfacial rheology, provided the experiment is designed within the valid range of the chosen method. [P1, P3, 1, 4, 6]
Why creating an interface requires work
The molecular origin of interfacial free energy can be understood without assigning a literal inward force to each surface molecule. What matters is that moving molecules from the bulk into an interfacial environment changes their interactions and entropy. The resulting excess free energy is integrated over a finite interfacial region whose thickness is molecular rather than macroscopic. Thermodynamics replaces this spatially diffuse region by an idealized dividing surface and attributes excess quantities—including adsorption—to that surface. [P1, P4, 1, 4, 6]
The magnitude of surface tension reflects the balance of cohesive interactions, molecular structure and thermal motion. Strongly cohesive liquids generally display larger surface tensions than weakly interacting liquids, while increasing temperature normally reduces γ because the density and energetic contrast between phases decreases. Approaching a critical point, the distinction between the coexisting phases vanishes and the interfacial tension tends toward zero. [P1]
In a multicomponent liquid, molecules that reduce the interfacial free energy preferentially populate the interface. Surfactants provide the canonical example. Their amphiphilic architecture combines chemical groups with different affinities for the adjacent phases, making interfacial localization energetically favorable. At a water–air interface, a typical surfactant orients its hydrophilic moiety toward water while its hydrophobic moiety avoids the aqueous bulk. At a water–oil interface, both sides offer molecular environments and adsorption can be coupled to with partitioning into the oil phase. [P1, P4, 1, 4, 6]
Interfacial tension as excess Gibbs free energy
Consider a system containing an interface of area A. When the area is increased reversibly while temperature, pressure and component amounts are constrained, additional free energy must be supplied. The proportionality coefficient is the interfacial tension. In differential form, the interfacial contribution augments the usual Gibbs fundamental equation by a term γdA. For a multicomponent system, chemical-potential terms account for changes in composition. [P1, 1, 4, 6]
γ = (∂G / ∂A)T,p,nᵢ
For a reversible change of interfacial area at constant temperature, pressure and amounts of all components. [P1, 1, 4, 6]
This formulation clarifies several points. First, surface tension is not merely an empirical force parameter; it is a free-energy density. Second, the value is associated with a defined thermodynamic state. Third, if the interface changes composition when its area changes, the apparent response can contain both mechanical and adsorption contributions. This becomes central in dilational interfacial rheology. [P1, P3, 1, 4, 6]
Surface pressure is often used when discussing adsorption layers. It is defined relative to a reference interface, typically the clean solvent surface, as π = γ₀ γ. Increasing adsorption of a − surface-active solute generally lowers γ and therefore increases π. This transformation is convenient because many equations of state for adsorption layers resemble two-dimensional pressure relations. [P1, P4, 6]
π = γ − γ₀
γ₀ denotes the tension of the reference solvent interface and γ that of the solution. [P1]
The Gibbs dividing surface and surface excess
A real interface has finite thickness. Gibbs introduced an idealized mathematical dividing surface that allows the total amount of each component to be decomposed into bulk contributions plus a surface excess. The surface excess concentration Γᵢ has units of amount per interfacial area. Its numerical value depends on the convention used to position the dividing surface, but measurable thermodynamic relationships are constructed such that the physical predictions remain well defined. [P1, 1, 4, 6]
In surfactant science, Γ is often interpreted as the adsorbed amount per area. At low coverage, molecules can be separated sufficiently that lateral interactions are weak. As coverage grows, excluded area, electrostatics, chain interactions, orientation changes and two-dimensional association can become important. This progression explains why progressively more elaborate adsorption models are required as one moves from dilute ideal layers toward dense interfacial films. [P1, P4, 6]
Curvature, capillary pressure and the Young–Laplace equation
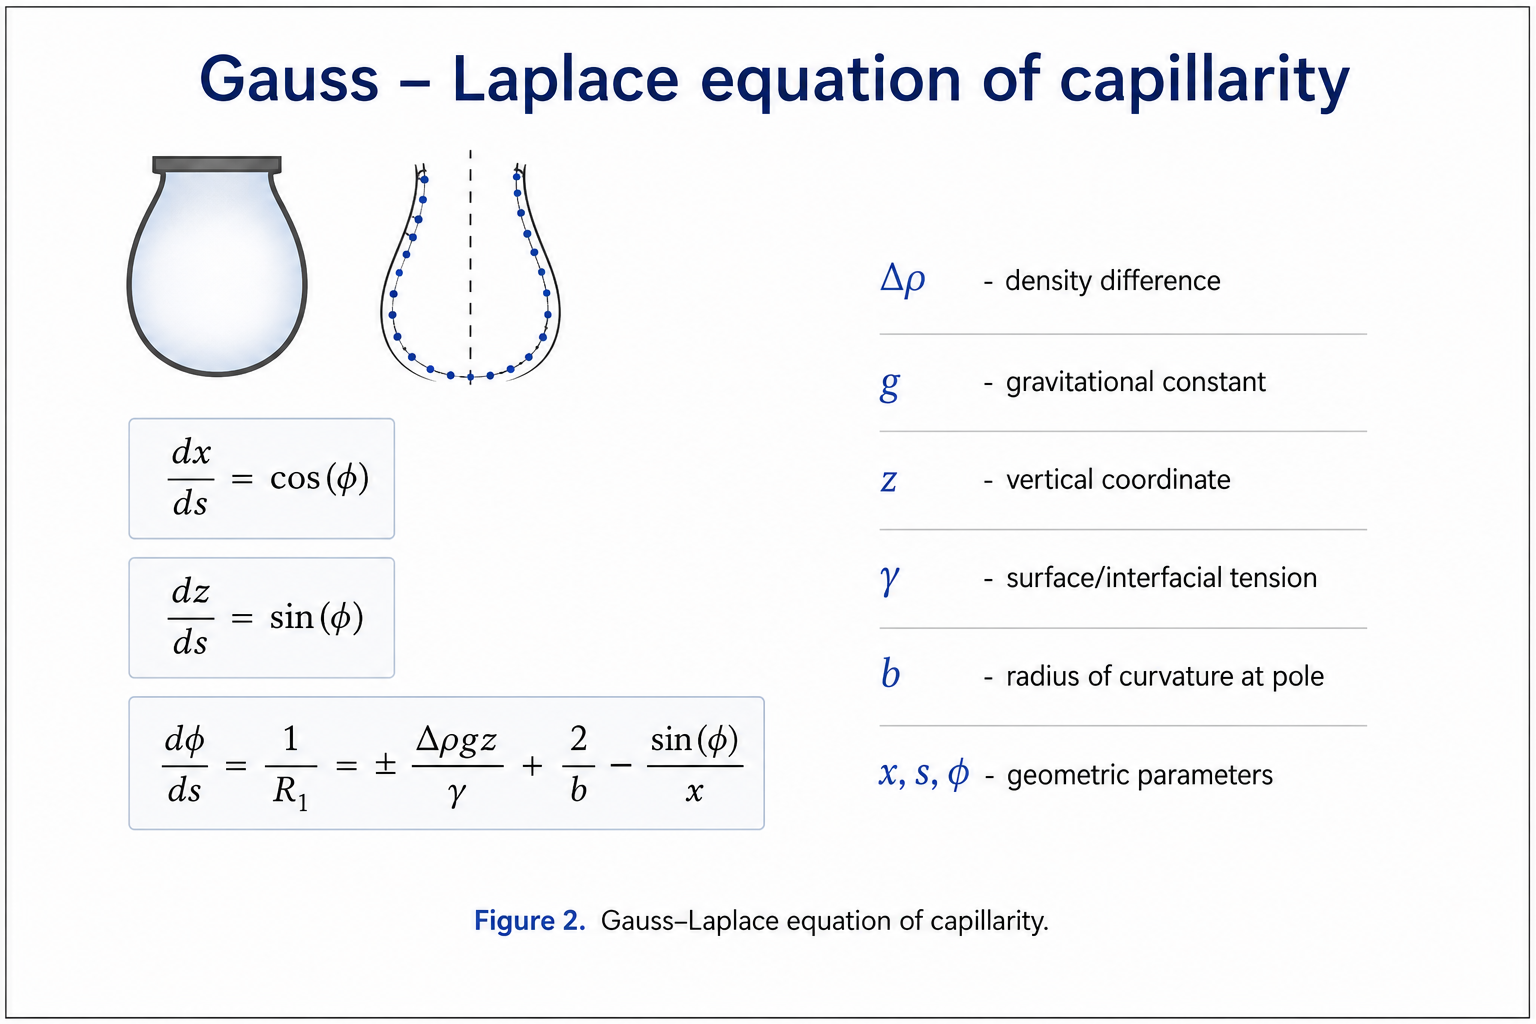
A curved interface sustains a pressure difference between its two sides. Mechanical equilibrium requires this pressure difference to be balanced by interfacial tension acting through curvature. For an interface with principal radii of curvature R₁ and R₂, the Young–Laplace equation gives the capillary pressure Δp. [P2, P3, 2, 3, 4]
Δp = γ (1/R₁ + 1/R₂)
The sign convention depends on the definition of pressure difference and interface normal; the magnitude is governed by the sum of principal curvatures. [P2, P3, 2, 3, 4]
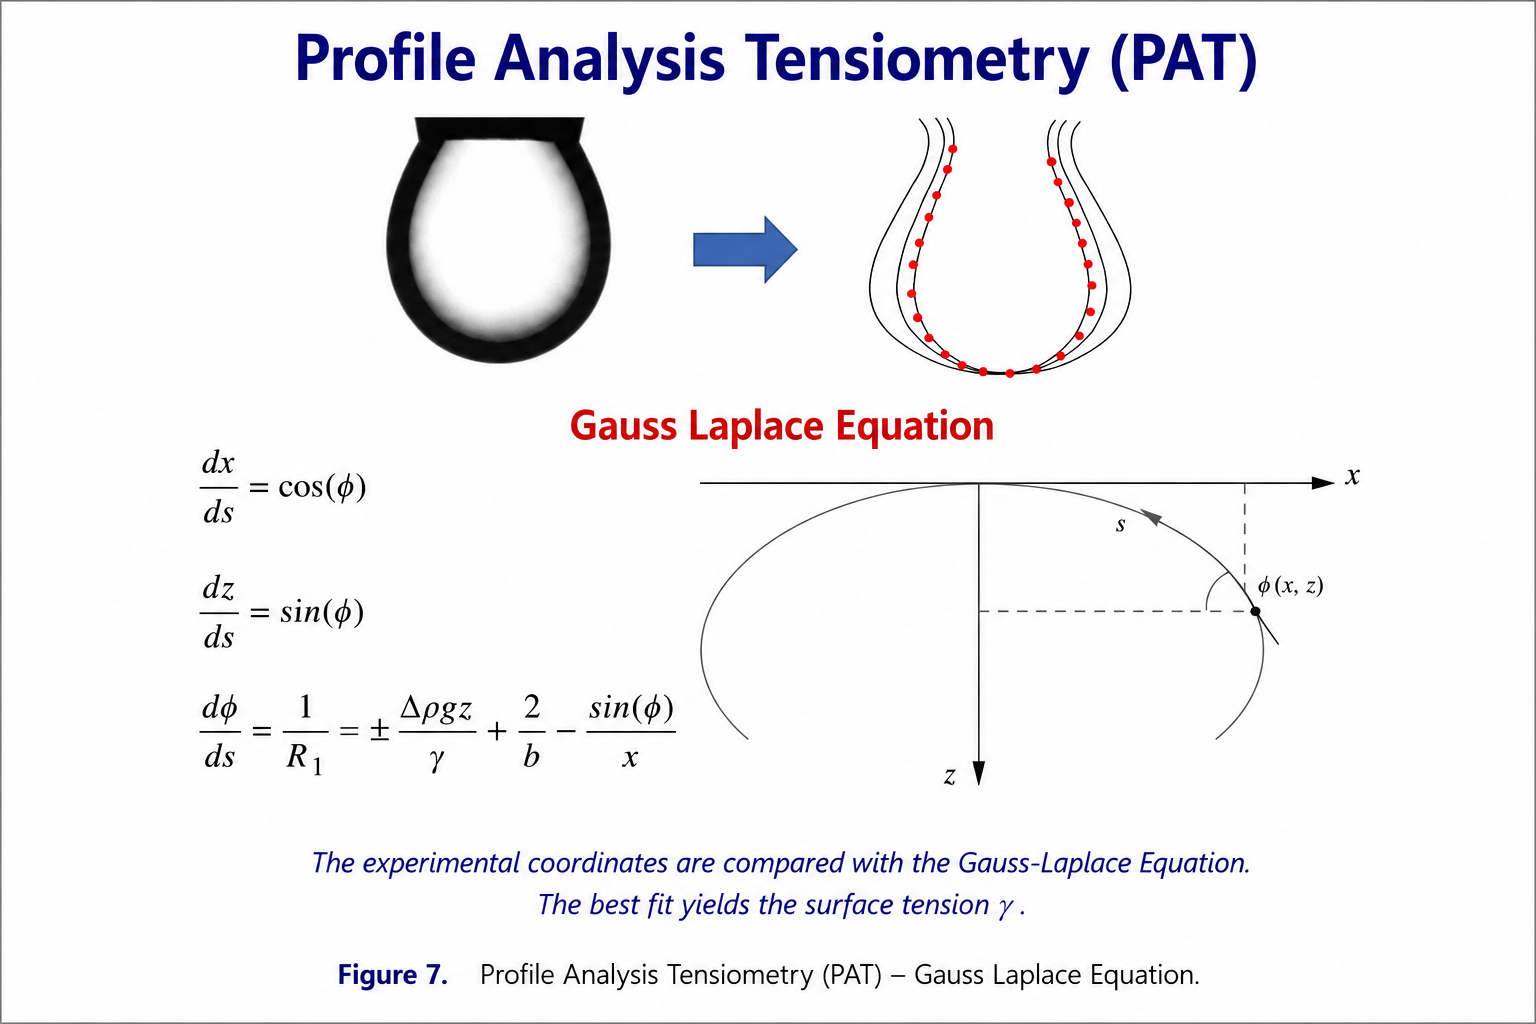
For a sphere, R₁ = R₂ = R and the expression simplifies to Δp = 2γ/R. Small bubbles or drops can therefore exhibit large capillary pressures. This simple relation underlies phenomena ranging from bubble stability to porous-media capillarity, but the general axisymmetric equation is required for profile analysis of pendant or sessile drops distorted by gravity. [P2, P3, 2, 3, 4]
The shape of a millimetric drop results from competition between interfacial tension, which tends to minimize area, and gravity, which deforms the drop. The density difference Δρ between the phases and gravitational acceleration g determine the hydrostatic pressure variation with height. By fitting an experimentally measured drop contour to the numerical solution of the Young–Laplace equation, γ can be inferred from the entire profile rather than from a single geometric feature. [P2, P3, 2, 3, 4]
Δp(z) = Δp₀ + Δρgz = γ(1/R₁ + 1/R₂)
The curvature varies along the contour because pressure changes with vertical coordinate z. [P2, P3, 2, 3, 4]
Why density difference matters. The gravitational deformation that contains information about γ scales with Δρ. In liquid–liquid systems with very small density differences, pendant-drop deformation may be weak even when the optical profile is excellent. Alternative geometries or capillary-pressure approaches can then become advantageous. [P2, P3, 2, 3, 4]
The Gibbs adsorption equation connects composition and surface tension
Surface-active solutes change interfacial tension because the equilibrium composition of the interface differs from that of the bulk. Gibbs adsorption thermodynamics expresses this relationship without requiring a molecular adsorption model. At constant temperature and pressure, the differential change of γ is related to the surface excesses Γᵢ and changes in the corresponding chemical potentials μᵢ. [P1, P4, 1, 4, 6]
dγ = − Σ Γᵢ dμᵢ
For a dilute solution in which the activity of the surface active component can be related to concentration, the equation can be written in a form involving the slope of surface tension against logarithmic activity. For nonionic surfactants under ideal dilute conditions, Γ is proportional to dγ/dln c divided by RT. Ionic surfactants require careful treatment of dissociation, counterions, ionic strength and the thermodynamic component convention. The common appearance of a stoichiometric factor should not obscure the underlying point: Gibbs’ equation is fundamentally an activity-based thermodynamic relation. [P1, P4, 1, 4, 6]
Γ = −(1 / mRT) (dγ / d ln c)
m represents the effective number of species whose chemical potentials change with the surfactant concentration under the adopted convention. [P1, P4, 1, 4, 6]
Experimentally, the Gibbs equation transforms a sufficiently accurate equilibrium surface-tension isotherm into an estimate of adsorbed amount. Because Γ depends on a derivative, data quality and smoothing strategy matter. Small systematic errors in γ can become amplified when slopes are evaluated. Equilibration must also be demonstrated: differentiating a dynamic γ(c,t) data set as if it represented equilibrium can produce a physically misleading adsorption isotherm. [P1, P4, 1, 4, 6]
Adsorption, micellization and the concentration axis
As surfactant concentration increases, interfacial coverage typically increases and γ decreases. At sufficiently high bulk concentration, micelles or other aggregates can form in the solution bulk. Above the critical micelle concentration, the monomer activity often changes much less strongly with total concentration, and the surface tension is correspondingly less concentration sensitive. The CMC is therefore frequently identified from a break or transition in γ versus log c, but the interpretation can be complicated by impurities, non-equilibrium state of adsorption, mixed surfactants and nonideal solution behavior. [P1, P4, 6]
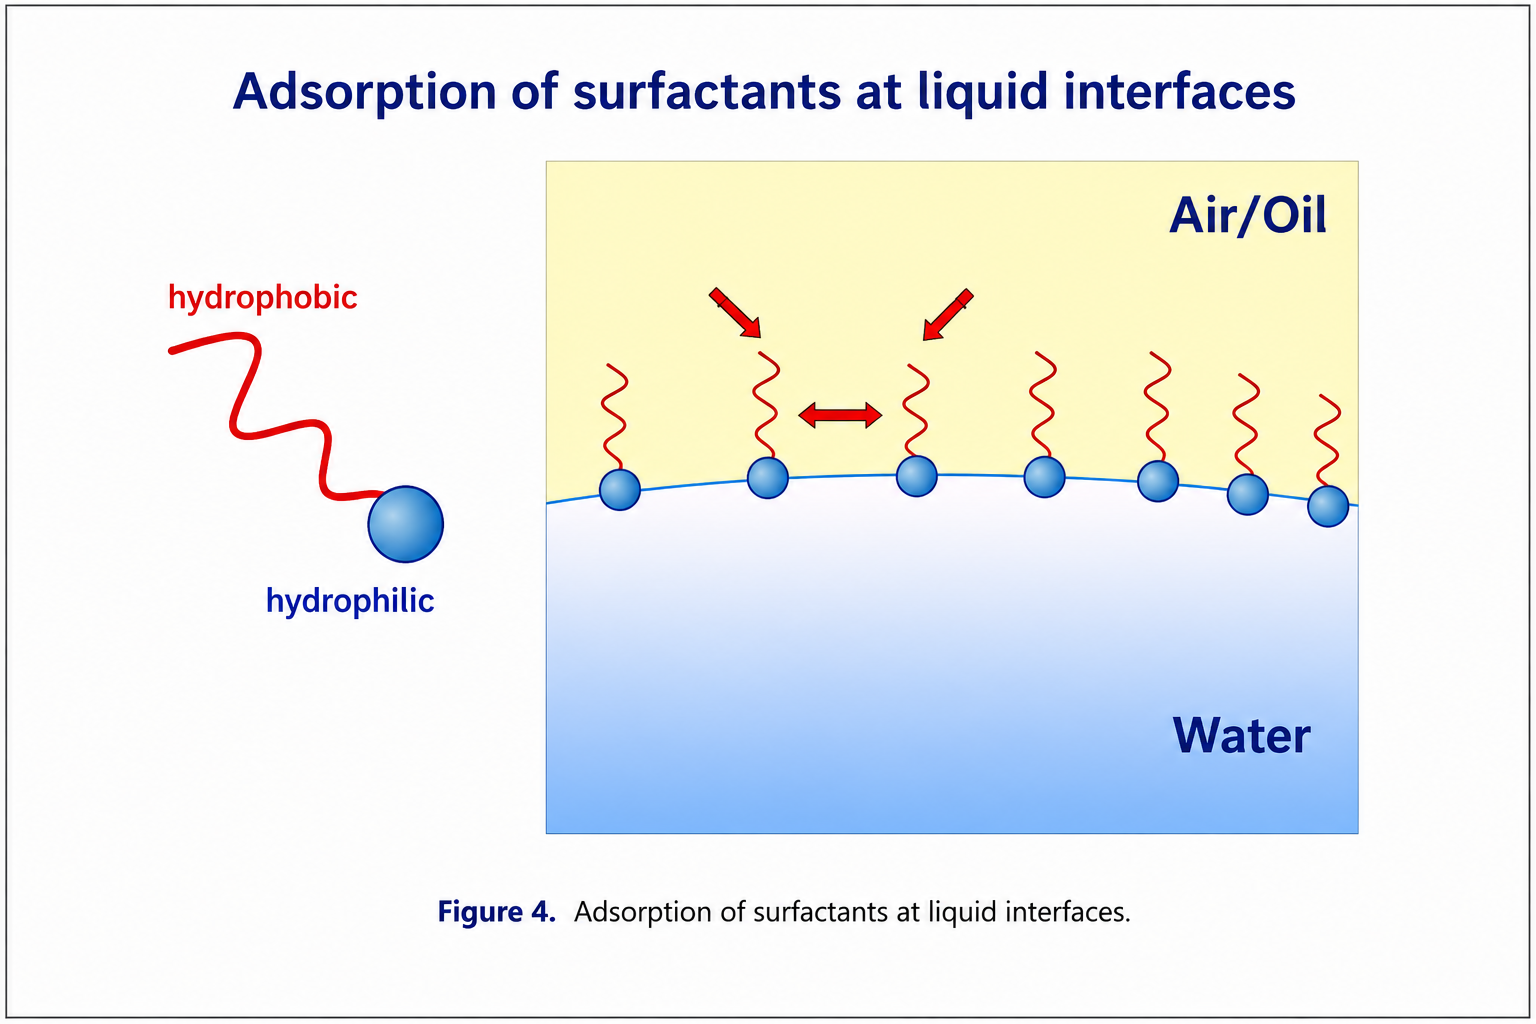
Liquid–liquid interfaces introduce additional phenomena. Hydrocarbons can participate in the interfacial layer; a surfactant may partition into both phases; competitive and cooperative adsorption can occur; and the apparent concentration in one phase may change because of transfer across the interface. A rigorous experiment must therefore define not only nominal composition but also phase volumes, equilibration history and the possibility of component redistribution. [P1, P4, 17, 18, 19]
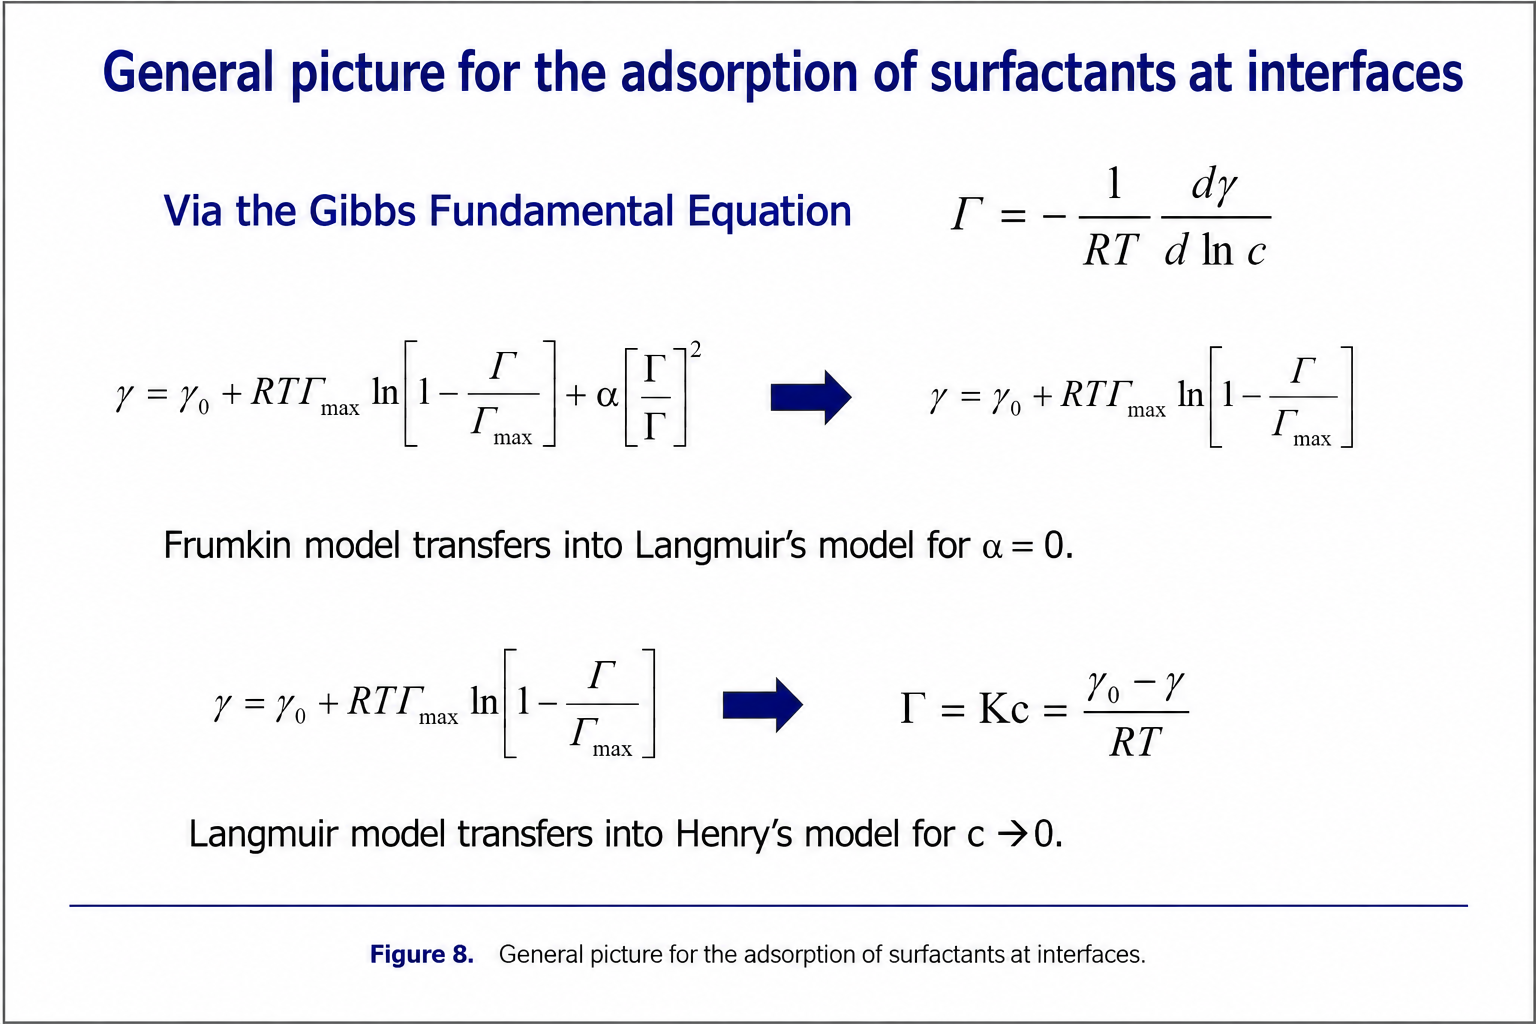
Adsorption models are not interchangeable fitting functions; each encodes a physical picture of the interfacial layer.
[P1, P4, 6]
Dilute limit
Henry adsorption: the dilute limit
The Henry model represents the low-coverage limit in which the adsorbed amount is proportional to bulk concentration and adsorbed molecules do not yet experience significant excluded area or lateral interactions. In this regime the interfacial layer behaves approximately as an ideal two-dimensional gas. The model is therefore valuable as an asymptotic description at low concentration but cannot represent saturation. [P1]
Γ = Kc
Henry-type adsorptionFinite capacity
Langmuir adsorption: finite interfacial capacity
The Langmuir model introduces localized adsorption sites or, equivalently, a finite interfacial area requirement per molecule. The fractional coverage approaches unity as concentration increases. Molecules are assumed not to interact laterally beyond occupancy restrictions. This makes the model substantially more realistic than Henry adsorption at moderate coverage, but still idealized for dense surfactant layers. [P1, P4, 6, 15, 16]
Γ = Γ∞ Kc / (1 + Kc)
Langmuir isothermLateral interactions
Frumkin adsorption: lateral interactions
The Frumkin framework extends Langmuir adsorption by accounting for interactions between adsorbed molecules. Attractive or repulsive interactions modify the relationship between bulk activity and interfacial coverage and can produce much steeper or more gradual isotherms than predicted by an ideal localized layer. Such interactions become increasingly relevant as the interface becomes crowded. [P1, P4, 6, 15, 16]
The physical meaning of an interaction parameter should be treated with care. It can summarize several molecular effects that are not separately resolved by a simple isotherm: hydrocarbon-chain association, electrostatic contributions, hydration changes or cooperative structural rearrangements. Good numerical agreement is not by itself proof of a unique microscopic mechanism. [P1, P4, 17, 18, 19]
Surface-tension relation
Szyszkowski-type surface-tension relations
The Szyszkowski relation provides a classical description of the concentration dependence of surface tension for many surface-active solutes. It is closely connected to Langmuir-type adsorption under appropriate assumptions and is useful for parameterizing equilibrium γ(c) curves in regimes where the model assumptions remain reasonable. [P1, P4, 6, 15, 16]
γ = γ − RTΓ∞ ln(1 + Kc) ₀
Representative Szyszkowski formReorientation and two-dimensional aggregation
Real surfactant molecules need not occupy one fixed area at all coverages. Their orientation can change as the layer becomes compressed, altering the partial molar area associated with adsorption. Reorientation models explicitly recognize that the mean molecular area can evolve with coverage. This is particularly important when a molecule can adopt multiple interfacial states rather than behaving as a rigid object. [P1, P4, 6, 15, 16]
At still higher coverage, lateral association can lead to two-dimensional aggregates within the adsorption layer. Fainerman and coworkers developed models in which surface aggregation is incorporated into the equation of state and adsorption isotherm. Such descriptions demonstrate an important general principle: a surface-tension isotherm can encode not only the amount adsorbed but also changes in the organization of the interfacial layer. [P1, P4, 6, 15, 16]
Dilute interface
No saturation
Finite capacity
No lateral interactions
Molecular interactions
Interaction parameter
Changing molecular area
Multiple interfacial states
Dynamic surface tension is the tension of a non-equilibrium interfacial state
A newly generated interface is initially characterized by the composition created during the formation process. If the bulk contains surface-active molecules, the interface subsequently evolves toward its equilibrium adsorption state. The tension therefore changes with interfacial age. For many surfactant solutions, γ begins closer to the tension of the solvent and decreases as adsorption proceeds, although more complex trajectories are possible in mixtures, of surfactants or with proteins or systems involving transfer between two liquid phases. [P1, P4, 6, 4, 5]
The term “dynamic surface tension” should be reserved for a measurement in which the characteristic interfacial age is defined and the method response is understood. Merely recording γ as a function of laboratory clock time does not automatically define the age of the measured interface. A pendant drop created at t = 0 provides a comparatively direct age definition if the interface subsequently remains intact. In maximum bubble pressure measurements, the surface is continuously created during bubble growth, and the relevant lifetime must be separated from deadtime and from the total bubble period. [P2, P3, 2, 3, 4]
Interfacial age
Dynamic surface tension requires a physically defined age of the interface rather than simply elapsed laboratory time.
Transport to the interface
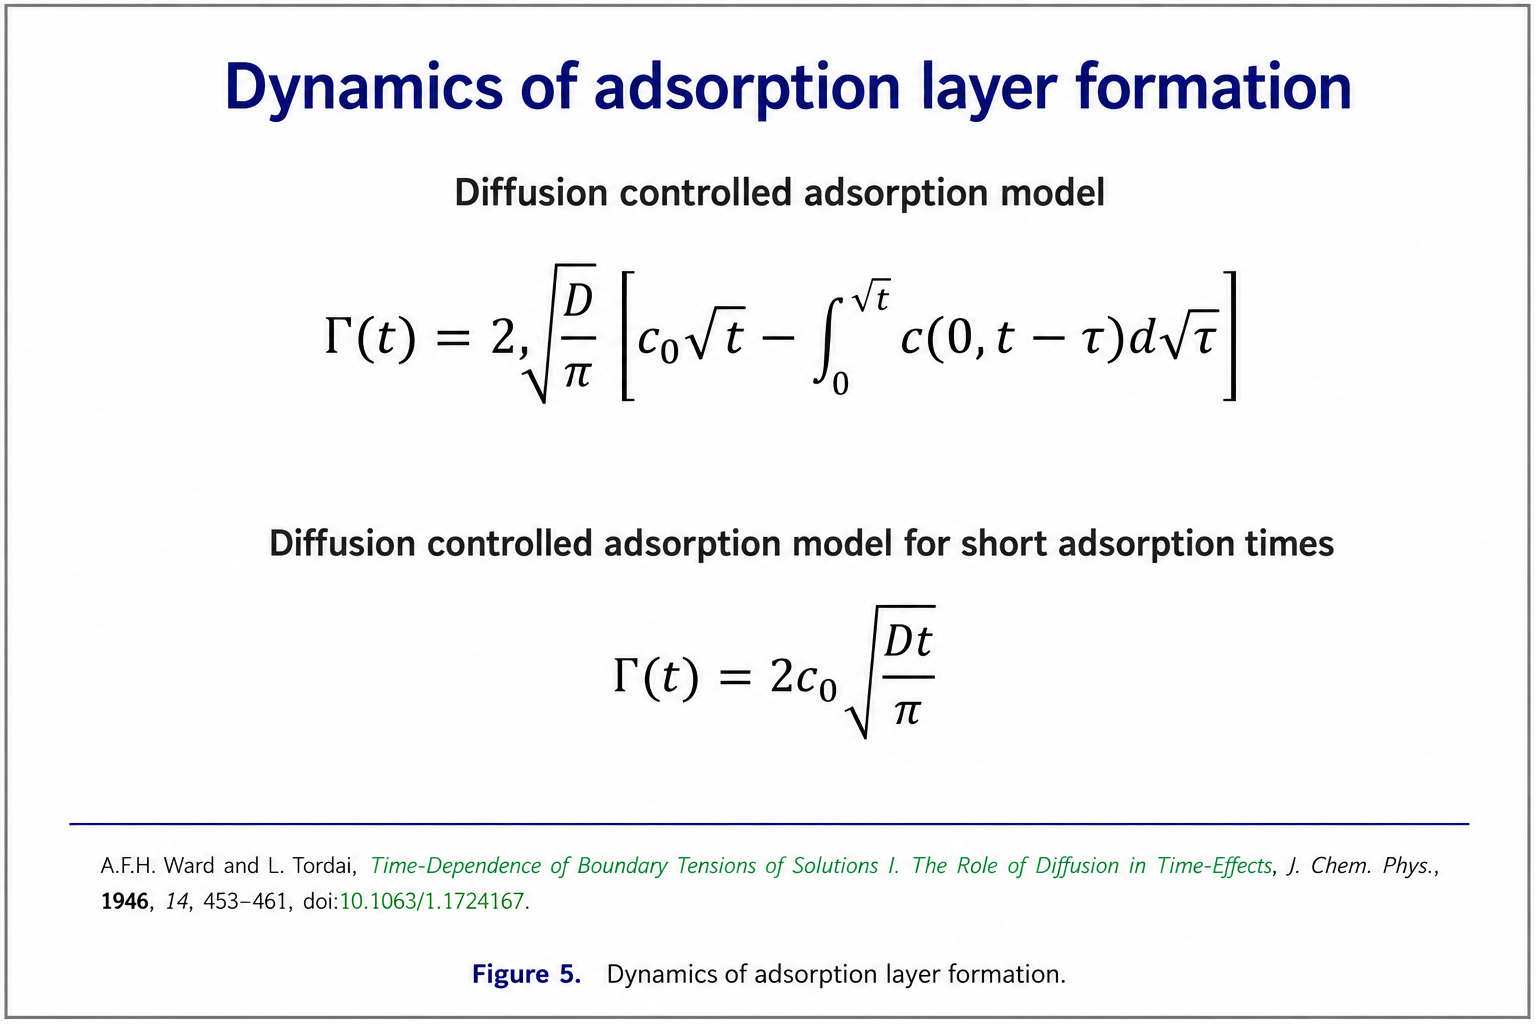
Adsorption kinetics can be limited by diffusion from the bulk, by convective transport, by an activation barrier near the interface, by molecular reorientation after adsorption, or by combinations of these processes. At early times, diffusion theory predicts a characteristic square-root-of-time behavior for the accumulation at an initially clean planar interface under idealized conditions. Curvature, finite volume, concentration-dependent diffusion, micellar relaxation and nonideal adsorption complicate the picture in real experiments. [P2, P3, 2, 3, 4]
The experimentally observed γ(t) is not itself the adsorption rate. Converting tension into Γ(t) requires an equation of state relating the interfacial composition to tension. A kinetic model therefore contains two conceptually distinct parts: transport determines how Γ evolves, while interfacial thermodynamics determines how a given Γ maps to γ. Failure to distinguish these steps can cause an empirical fit to be mistaken for a mechanistic adsorption law. [P1, P4, 1, 4, 6]
Growing interfaces
Many practical interfaces do not retain constant area while adsorption occurs. Drops and bubbles can grow, and a surfactant population already adsorbed at the interface is then diluted by expansion while new molecules continue to arrive from the bulk. MacLeod and Radke formulated a growing-drop framework in which adsorption kinetics are coupled to the time-dependent radius and surface area. The problem illustrates why dynamic tensiometry must account for the actual area history rather than assigning all observations to a static planar interface. [P3, P1, 9, 6]
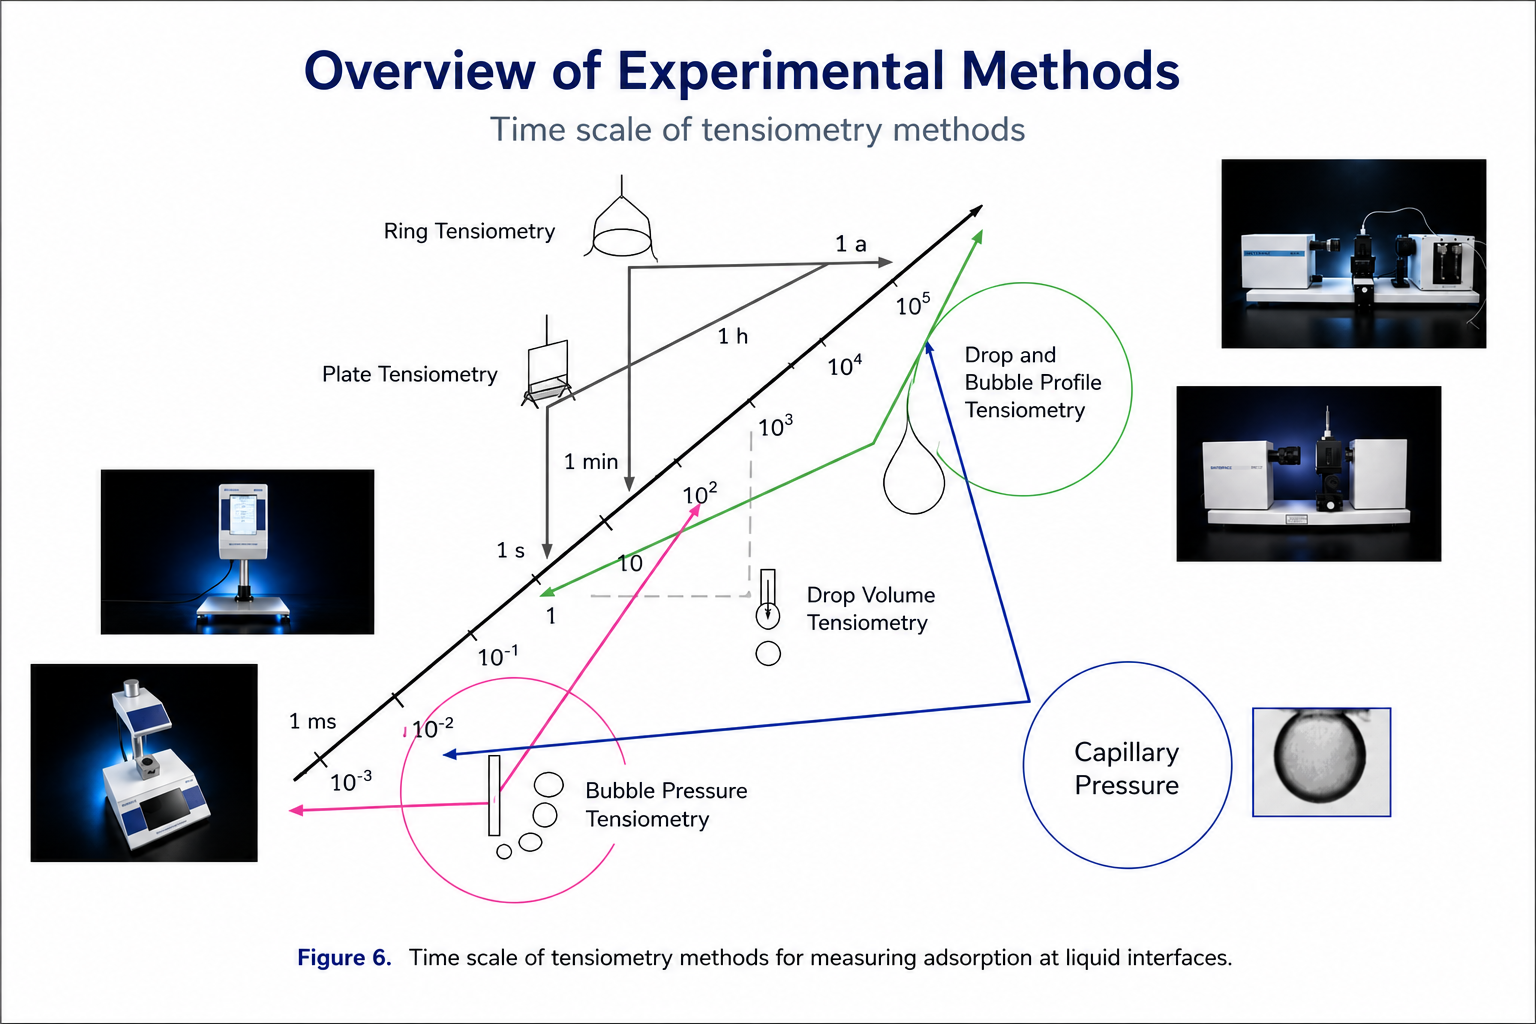
Dynamic measurements are method-complementary. Bubble pressure tensiometry accesses the shortest practical surface ages, while drop and bubble profile analysis extends observation to seconds, minutes and hours and is particularly versatile for liquid–liquid interfaces. Intermediate techniques such as drop-volume methods occupy additional time windows. A scientifically complete kinetic study may therefore combine methods rather than forcing one instrument beyond its physical range. [P2, P3, 2, 3, 4]
Bubble pressure
Drop-volume methods
Profile analysis
Depletion and finite-volume effects
Adsorption removes solute from the bulk. In a macroscopic reservoir this depletion can be negligible; in a small pendant drop it can be substantial. The available number of surfactant molecules scales with drop volume, whereas the adsorbing interface scales with surface area. At low concentration and high adsorption, the final bulk concentration can therefore be significantly smaller than the nominal initial concentration. Mass balance must then be included in the interpretation. [P2, P3, 2, 3, 4]
c₀V = cV + ΓA
For a single drop under a simple one-component balance; additional phases, transfer and aggregation require extension. [P1]
The geometry dependence explains an experimentally important asymmetry: depletion can be pronounced for a liquid drop containing the surfactant, whereas for a bubble in a large surrounding liquid reservoir the ratio of available bulk volume to interfacial area can be far greater. Comparing drop and bubble experiments can therefore reveal finite-volume artefacts rather than an intrinsic difference in adsorption physics. [P1, P4, 6, 4, 5]
No tensiometric method is universally valid
The experimental question determines the geometry, time window and correction strategy. [P1]
Surface and interfacial tension can be determined from forces, pressures, shapes or detachment conditions. These observables are different manifestations of the same interfacial thermodynamics, but the experimental assumptions differ. Method selection must therefore begin with the required interfacial age, phase combination, expected tension range, density difference, available sample volume, temperature, viscosity and susceptibility to contamination. [P1, 1, 4, 6]
Time windows should be treated as indicative rather than as immutable instrument specifications. The physically meaningful lower and upper limits depend on hardware, analysis model, viscosity, capillary geometry, data-acquisition rate and the required uncertainty. A method can often generate a numerical value outside its recommended range; that does not guarantee that the value represents interfacial tension. [P2, P5, 4, 5]
The complete drop or bubble contour becomes the measurement signal
Profile analysis tensiometry determines surface or interfacial tension from the shape of an axisymmetric pendant or sessile drop, or from an attached bubble. An optical system records the interface, edge-detection algorithms extract the contour and a numerical solution of the Young–Laplace equation is fitted to the experimental coordinates. The fitted tension is the value for which the calculated hydrostatic deformation best reproduces the observed profile. [P2, P3, 2, 3, 4]
The method is powerful because it uses a distributed geometric data set rather than a single force or pressure maximum. Sub-pixel contour localization and a well-characterized optical scale permit high precision when the profile contains sufficient gravitational deformation. Calibration of the image scale, knowledge of Δρ and verification using pure reference liquids are essential parts of a reliable measurement chain. [P1]
Pendant drops at liquid–gas and liquid–liquid interfaces
For a pendant liquid drop in gas, the surrounding phase typically contributes little to the density. For a liquid drop immersed in another liquid, both densities enter through Δρ. Profile analysis is particularly attractive in liquid–liquid research because the interface can be observed for long times without physical contact by a force probe. Adsorption from either phase, partitioning and transfer across the interface can be studied under controlled composition. [P2, P3, 2, 3, 4]
The same flexibility creates interpretive responsibilities. If surfactant is contained inside a finite pendant drop, adsorption may deplete the drop. If a solute is soluble in both phases, its concentration can evolve because of interphase transfer. If the drop volume is changed deliberately, the surface concentration is perturbed. A profile tensiometer provides the geometric and tension data, but a mechanistic interpretation must include the relevant mass balances. [P2, P3, 2, 3, 4]
Oscillating drops and dilational response
Controlled periodic variation of drop volume generates a periodic variation of interfacial area. The resulting tension response can differ in amplitude and phase from the imposed area oscillation. This response is used to characterize dilational elasticity and viscosity of adsorption layers. In the simplest linear representation, the complex dilational modulus relates a small relative area perturbation to the corresponding oscillatory surface-tension response. [P3, P1, 20, 7, 6]
E* = dγ / d ln A = E′ + iE″
E′ represents the elastic component and E″ the loss component in a linear oscillatory experiment. [P3, 7]
Frequency is central because the interface possesses its own relaxation times. At low frequency, adsorption/desorption and exchange with the bulk may partially restore equilibrium during each cycle. At high frequency, the interfacial composition can be effectively trapped over the oscillation period, producing a different apparent elasticity. Consequently, “the interfacial elasticity” is not generally a single constant but a frequency-dependent material response. [P3, P1, 7, 6, 4]
Accessing adsorption at the shortest interfacial ages
Maximum bubble pressure tensiometry is one of the most widely used approaches for dynamic surface tension at short surface ages. Gas is driven through a submerged capillary and a bubble grows at the capillary tip. The pressure rises as the bubble curvature changes, reaches a characteristic maximum and then falls as the bubble continues to grow and detaches. At the appropriate geometric condition, the capillary pressure contribution to the pressure maximum is related to surface tension. [P2, P3, 2, 3, 4]
The measured pressure signal contains more than the desired capillary pressure. Hydrostatic pressure due to immersion depth, hydrodynamic pressure losses associated with gas and liquid motion, and pneumatic effects of the measuring system can contribute. Accurate dynamic tensiometry therefore requires a pressure balance and correction strategy rather than direct conversion of a raw pressure maximum into γ. [P2, P5, 4, 5]
pmeas = pcapillary + phydrostatic + phydrodynamic + …
The precise correction terms depend on instrument geometry, capillary radius, flow conditions and analysis protocol. [P2, P5, 4, 5]
Surface lifetime is not identical to bubble time
A key methodological distinction is the separation of the bubble period into deadtime and surface lifetime. The bubble time may include intervals that do not correspond to the age of the interface at the pressure maximum used to determine γ. Treating the complete cycle time as “surface age” can therefore distort a dynamic surface-tension curve, especially at the shortest times. Rigorous instruments and protocols explicitly define the relevant lifetime. [P3, 13, 14]
This distinction becomes particularly important when comparing data from different bubble-pressure devices. Two instruments can report measurements at nominally similar bubble frequencies while creating different actual interface histories because of differences in capillary geometry, pneumatic volume or bubble growth profile. Cross-instrument agreement requires consistent definitions and appropriate corrections. [P2, P5, 4, 5]
Why equilibrium extrapolation is hazardous
Because bubble-pressure measurements are optimized for short times, it can be tempting to extrapolate γ(t) toward infinite surface age to estimate equilibrium tension. Such extrapolation is model dependent and can be inaccurate when the measured time domain does not contain the slow relaxation processes that dominate the approach to equilibrium. A long-time equilibrium method is preferable when the equilibrium value itself is the principal quantity of interest. [P1]
Force, detachment and capillary techniques provide independent experimental windows
Plate geometry
Wilhelmy plate tensiometry
In the Wilhelmy plate method a thin plate intersects the interface and the vertical force acting on the plate is measured. The interfacial contribution is γP cosθ, where P is the wetted perimeter and θ the contact angle. For a completely wetted plate θ approaches zero and cosθ approaches unity. In practice, plate material, roughness, cleaning procedure and dynamic wetting behavior determine how defensible this assumption is. Buoyancy corrections are required when immersion changes. [P2, P5, 4, 5]
Fγ = γP cosθ
Ring geometry
Du Noüy ring method
The ring method measures a force maximum while a ring is drawn through an interface. The observed force cannot generally be interpreted using a simple perimeter multiplication alone because the meniscus geometry evolves during withdrawal. Classical correction factors are therefore used. The technique remains widespread, but automated profile methods avoid several contact-geometry assumptions and provide access to richer time-dependent information. [P2, P5, 4, 5]
Capillary drop
Drop volume and drop weight
Drop-volume methods infer tension from the condition of drop detachment at a capillary. Their intuitive force balance makes them attractive, and they can access time windows between rapid bubble-pressure measurements and long-time static methods. However, the detachment process is hydrodynamic. Continued liquid inflow while the neck thins can change the detached volume and produce flow-rate-dependent apparent tension. Dynamic use therefore requires an experimentally validated operating regime. [P2, P5, 4, 5]
Known curvature
Capillary pressure approaches
Pressure-based methods can determine interfacial tension from a known or simultaneously observed interface curvature. They are particularly valuable when density differences are too small for strong gravity-induced deformation in pendant-drop analysis. Accurate pressure sensors, precise capillary geometry and control of hydrostatic contributions are critical. In liquid–liquid systems, such approaches can provide unique access to adsorption under conditions where other geometries become insensitive. [P2, P3, 2, 3, 4]
Most serious tensiometric errors arise from the interface history, not from arithmetic
Cleanliness and trace surface-active contamination
Interfaces are exceptionally sensitive to surface-active impurities because adsorption concentrates material from a three-dimensional bulk into a two-dimensional layer. A contaminant present at a concentration that appears negligible analytically can still modify γ after sufficient adsorption time. Water is therefore a demanding reference sample: a slowly decreasing surface tension can indicate contamination of the liquid, vessel, tubing, capillary or ambient environment. [P1, P4, 6, 4, 5]
Cleaning procedures must be compatible with the materials of the measuring system and validated experimentally. “Clean” should be demonstrated by reproducible reference behavior, not assumed from a washing protocol. Disposable components can reduce cross-contamination but introduce their own extractables and wetting characteristics. [P2, P5, 4, 5]
“Clean” should be demonstrated by reproducible reference behavior, not assumed from a washing protocol.
Temperature and evaporation
Surface tension is temperature dependent, and adsorption equilibria and kinetics are also temperature sensitive. Temperature must therefore be measured at or near the sample rather than inferred from room conditions. Volatile phases can change composition during long measurements, particularly in small drops. Evaporation can reduce drop volume, concentrate solutes and alter interfacial temperature. Closed or vapor-saturated measurement cells may be required. [P3, P1, 20, 6, 4]
Density, viscosity and phase composition
Profile analysis requires accurate phase densities because the fitted tension scales with density difference. Bubble-pressure measurements require attention to viscosity and hydrodynamic pressure contributions at rapid gas flow. Liquid–liquid experiments require both phases to be compositionally defined; pre-saturation can be necessary when mutual solubility would otherwise cause continuous drift. [P2, P3, 2, 3, 4]
Interfacial age and initial load
The earliest measurable tension can already reflect adsorption that occurred during interface formation. The “initial” surface is therefore not necessarily surfactant free. Different drop formation speeds, dosing paths or bubble-growth histories can create different initial loads. At high surfactant concentrations, adsorption may be so rapid that the instrument never observes the clean-interface limit. Comparing kinetic curves then requires matching the formation protocol, not just the nominal start time. [P1, P4, 6, 4, 5]
Most serious tensiometric errors arise from the interface history, not from arithmetic
The relevant tension is set by the process timescale
Equilibrium and dynamic measurements answer different questions.
Surfactants and detergents
Equilibrium isotherms reveal surface activity and adsorption strength, whereas dynamic measurements quantify how rapidly a newly created interface is populated. This distinction is essential when formulation performance depends on milliseconds rather than on the equilibrium state. [P1, P4, 6]
Emulsions and food systems
Interfacial tension controls the energetic cost of droplet formation, while adsorption kinetics of proteins, phospholipids and low-molecular-weight surfactants determines the composition and mechanical state of freshly generated oil–water interfaces. [P1, P4, 6]
Foams
Surface tension participates directly in bubble generation, but foam persistence cannot be inferred from γ alone. Adsorption kinetics, interfacial viscoelasticity, thin-film drainage and disjoining-pressure phenomena must be considered together. [P3, P1, 7, 6]
Pharmaceuticals and biophysics
Protein adsorption, pulmonary surfactants, lipid layers and mixed protein–surfactant interfaces are intrinsically time dependent. Controlled interfaces permit separation of transport, adsorption, rearrangement and interfacial mechanical response. [P1, P4, 6]
Coatings, inks and printing
The relevant interfacial age may be comparable to nozzle formation, atomization or coating times. Dynamic rather than equilibrium surface tension can therefore govern wetting, breakup, leveling and defect formation. [P1]
Surface tension does not equal foam or emulsion stability
A recurring interpretive error is to treat low surface tension as synonymous with high foamability or emulsion stability. Tension determines the reversible energy required to create area, but stability after area has been created depends on additional phenomena. These include adsorption kinetics, interfacial viscoelasticity, Marangoni stresses, film drainage, disjoining pressure, coalescence barriers and bulk rheology. Tensiometry is therefore a fundamental measurement, not a complete stability test. [P1, P3, 1, 4, 6]
The distinction is scientifically useful rather than limiting. By combining tension with interfacial rheology and thin-film measurements, one can separate energetic, kinetic and mechanical contributions that would otherwise be conflated in a single macroscopic foam or emulsion test. This multi-method approach is particularly informative for proteins, polymer–surfactant mixtures and complex formulations. [P3, P1, 7, 6]
Surface tension does not equal foam or emulsion stability.
Selecting an instrument from the scientific question
Instrument choice should follow the physics of the interface. Profile analysis tensiometers are the general platform when the complete evolution of a drop or bubble must be resolved across seconds to hours, when liquid–liquid interfaces are central, or when controlled volume changes are used to perturb an adsorption layer. Maximum bubble pressure instruments are complementary when the primary question concerns adsorption at very short surface ages. [P2, P3, 2, 3, 4]
Instrument references are intentionally separated from the scientific argument. The physical principles in this review are independent of a particular commercial instrument. Product platforms are listed only after the method-selection criteria, so that the experimental question—not the product name—determines the measurement strategy. [P1]
Choose the measurement platform from the interface physics.
SINTERFACE instrumentation covers complementary experimental windows for equilibrium measurements, adsorption kinetics, liquid–liquid interfaces and dynamic surface tension.
Explore all instrumentsPAT-1M
Versatile platform for surface and interfacial tension, adsorption kinetics, liquid–liquid interfaces and controlled drop or bubble experiments.
View PAT-1MAdvanced Profile AnalysisPAT-2S
Advanced profile analysis platform for demanding equilibrium and dynamic interface measurements.
View PAT-2SMaximum Bubble PressureBPA-2S
High-performance dynamic surface tension measurements at short and very short interfacial ages.
View BPA-2SDynamic Surface TensionBPA-2P
Compact bubble-pressure platform for routine and mobile dynamic surface tension measurements.
View BPA-2PProfile Analysis Tensiometry
PAT-1M · PAT-2S
Maximum Bubble Pressure
BPA-2S · BPA-2P
Interfacial tension becomes most informative when equilibrium, kinetics and mechanics are kept conceptually distinct
Surface and interfacial tension provide a rigorous link between molecular interactions and macroscopic interface behavior. In equilibrium thermodynamics, γ is the reversible free-energy cost of increasing interfacial area. Mechanically, it couples curvature to capillary pressure through the Young–Laplace equation. In multicomponent systems, changes in γ reflect adsorption and are related to bulk chemical potentials through the Gibbs adsorption equation. These are complementary views of one interfacial state variable. [P1, P2, 1, 4, 6]
The principal complication—and one of the principal sources of information—is time dependence. Newly created interfaces are commonly out of adsorption equilibrium. The measured tension then depends on molecular transport by diffusion, adsorption barriers, molecular rearrangement, area history and finite-volume effects. Dynamic tension must therefore be reported together with a physically meaningful interfacial age. The most useful experiments do not ask for “the” surface tension of a formulation, but for the tension of a defined interface under a defined history. [P1, P4, 6]
Modern tensiometry offers complementary routes to this information. Drop and bubble profile analysis combines optical geometry with the Young–Laplace equation and is exceptionally versatile across equilibrium, adsorption kinetics, liquid–liquid interfaces and controlled oscillations. Maximum bubble pressure tensiometry extends dynamic measurements into the shortest practical age regime. Force, detachment and capillary-pressure techniques add independent time windows and validation opportunities. [P2, P3, 2, 3, 4]
The scientific standard for surface and interfacial tension measurements is consequently not defined by numerical precision alone. It requires control of phase composition, cleanliness, temperature, geometry, mass balance and interfacial history; an analysis model valid for the measurement regime; and a method whose physical time window matches the process being studied. Under these conditions, tensiometry becomes a quantitative probe of interface formation rather than a simple measurement of a static material property. [P1]
Tensiometry becomes a quantitative probe of interface formation rather than a simple measurement of a static material property.
Scientific sources
This review is based on scientific material by the SINTERFACE team and the published literature listed in the References section.
Basic theories in surface and interfacial phenomena.
Surface and Interfacial Tension Measurements.
Profile Analysis Tensiometry (PAT) and Maximum Bubble Pressure (BPT): Fundamentals and Applications.
Experimental methods to measure the adsorption at liquid interfaces.
Simple Experimental Methods.
Published literature
J. W. Gibbs, The Collected Works of J. Willard Gibbs, Vol. 1: Thermodynamics, Longmans, Green and Co., 1928.
T. Young, An Essay on the Cohesion of Fluids, Philosophical Transactions of the Royal Society of London 95 (1805) 65–87.
P. S. Laplace, Traité de Mécanique Céleste, Supplement to Book X, Paris, 1805.
A. I. Rusanov and V. A. Prokhorov, Interfacial Tensiometry, Studies in Interface Science, Vol. 3, Elsevier, Amsterdam, 1996.
D. Möbius and R. Miller (Eds.), Drops and Bubbles in Interfacial Research, Studies in Interface Science, Vol. 6, Elsevier, Amsterdam, 1998.
V. B. Fainerman, D. Möbius and R. Miller (Eds.), Surfactants: Chemistry, Interfacial Properties, Applications, Studies in Interface Science, Vol. 13, Elsevier, Amsterdam, 2001.
R. Miller and L. Liggieri (Eds.), Interfacial Rheology, Progress in Colloid and Interface Science, Vol. 1, CRC Press / Taylor & Francis, 2009.
R. Miller and L. Liggieri (Eds.), Bubble and Drop Interfaces, Progress in Colloid and Interface Science, Vol. 2, 2011.
C. A. MacLeod and C. J. Radke, A growing drop technique for measuring dynamic interfacial tension, Journal of Colloid and Interface Science 166 (1994) 73–78.
M. Ferrari, L. Liggieri, F. Ravera, C. Amodio and R. Miller, Adsorption kinetics of alkyl phosphine oxides at the water/hexane interface. 1. Pendant drop experiments, Journal of Colloid and Interface Science 186 (1997) 40–45.
J. K. Ferri, R. Miller and A. V. Makievski, Equilibrium and dynamics of PEO/PPO/PEO penetration into DPPC monolayers, Colloids and Surfaces A 261 (2005) 39–48.
T. Kairaliyeva, E. V. Aksenenko, N. Mucic, A. V. Makievski, V. B. Fainerman and R. Miller, Surface tension and adsorption studies by drop profile analysis tensiometry, Journal of Surfactants and Detergents 20 (2017) 1225–1241.
V. B. Fainerman and R. Miller, Maximum bubble pressure tensiometry: theory, analysis of experimental constraints and applications, in: Bubble and Drop Interfaces, 2011, pp. 75–118.
J. Meissner, J. Krägel, C. Frese, S. Rupert, V. B. Fainerman, A. V. Makievski and R. Miller, Comparative studies of dynamic surface pressure using different maximum bubble pressure tensiometers, SÖFW-Journal 130 (2004) 41–46.
V. B. Fainerman, R. Miller, R. Wüstneck and A. V. Makievski, Adsorption isotherm and surface tension equation for a surfactant with changing partial molar area. 1. Ideal surface layer, Journal of Physical Chemistry 100 (1996) 7669–7675.
V. B. Fainerman and R. Miller, Surface tension isotherms for surfactant adsorption layers including surface aggregation, Langmuir 12 (1996) 6011–6014.
V. B. Fainerman, N. Mucic, V. Pradines, E. V. Aksenenko and R. Miller, Adsorption of alkyltrimethylammonium bromides at water/alkane interfaces—competitive adsorption of alkanes and surfactants, Langmuir 29 (2013) 13783–13789.
V. B. Fainerman, E. V. Aksenenko, A. V. Makievski, M. V. Nikolenko, A. Javadi, E. Schneck and R. Miller, Particular behavior of interfacial tension at the interface between aqueous surfactant solutions and alkane, Langmuir 35 (2019) 15214–15220.
V. B. Fainerman, E. V. Aksenenko, V. I. Kovalchuk, N. Mucic, A. Javadi, L. Liggieri, F. Ravera, G. Loglio, A. V. Makievski, E. Schneck and R. Miller, New view of the adsorption of surfactants at the water/alkane interface—competitive and cooperative effects, Advances in Colloid and Interface Science 279 (2020) 102143.
A. Javadi, R. Miller and V. B. Fainerman, Drop volume tensiometry, in: Bubble and Drop Interfaces, Progress in Colloid and Interface Science, 2011, pp. 119–141.
Continue exploring the science and measurement of liquid interfaces.