
01 · Measurement principle
Surface tension from the complete shape of a fluid interface
Profile analysis tensiometry determines surface or interfacial tension from the complete shape of an axisymmetric pendant or sessile drop or bubble.
A video image is acquired, the interface contour is extracted, and the experimental coordinates are compared with the numerical solution of the Gauss–Young–Laplace equation. The best fit yields γ.
Gauss–Young–Laplace equation
02 · Drop shape
Gravity provides the deformation required for profile analysis
Gravity deforms a sufficiently large drop away from a sphere. The extent of this deformation depends on the density difference Δρ and on γ.
By fitting the entire contour, profile analysis uses more geometric information than a single diameter or detachment force.
Sub-pixel edge detection and accurate optical calibration are therefore central to high precision.
03 · Dynamic measurements
The same interface can be followed continuously
Once a pendant drop or bubble has been created, its profile can be recorded continuously.
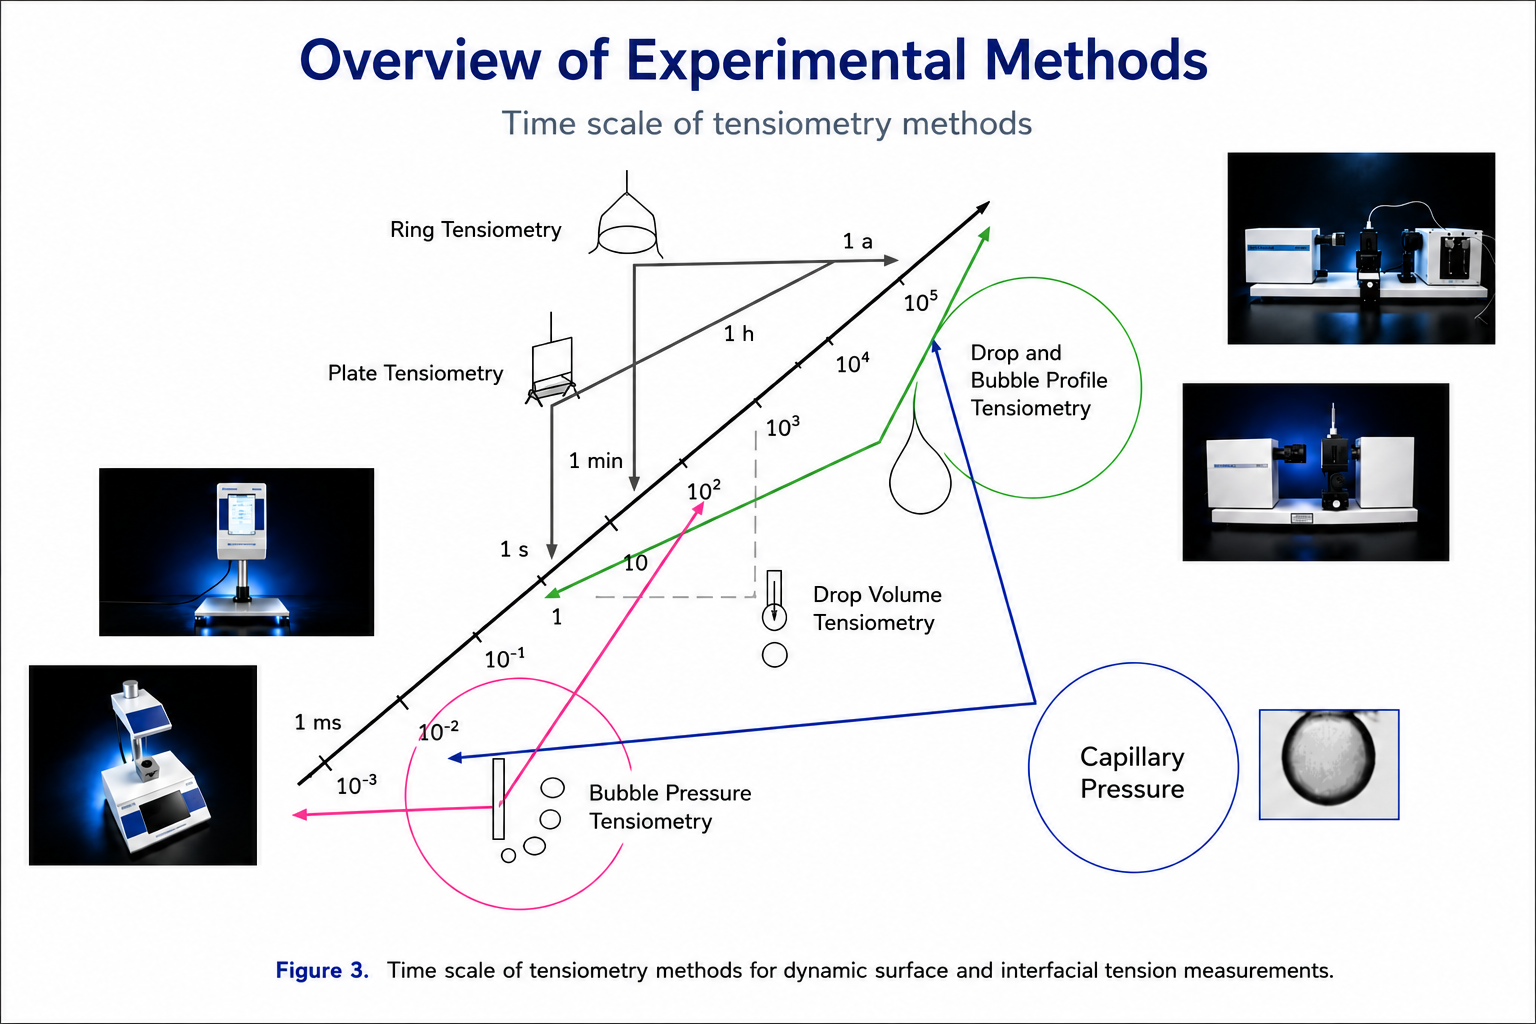
This makes profile analysis particularly suitable for adsorption kinetics from approximately seconds to hours. The same interface can be followed as γ evolves, avoiding the need to create a new interface for every data point, as in bubble pressure or drop volume tensiometry.
04 · Liquid–liquid interfaces
Profile analysis is particularly useful for immersed interfaces
For liquid–liquid systems, profile analysis is especially attractive because the interface can remain immersed and undisturbed while the adsorption process proceeds.
Surfactant can be present in the drop, in the surrounding phase or in both.
The interpretation must then consider partitioning and possible transfer between phases.
05 · Finite-drop depletion
Adsorption can change the bulk concentration inside a finite drop
The major dynamic complication of a pendant solution drop is depletion. Adsorption removes surfactant from the finite drop volume.
When the total amount available in the drop is comparable to the adsorbed amount, the bulk concentration decreases during the experiment.
Finite-drop mass balance
c₀ is the initial concentration, c the concentration after adsorption, V the drop volume and A the interfacial area.
Depletion can be significant for a range of surfactants and must be accounted for in quantitative analysis of dynamic tension and adsorption.
The corresponding effect is often much smaller for a bubble immersed in a large liquid reservoir because the accessible bulk volume is much larger relative to the bubble area.
This explains why drop and bubble measurements can yield different apparent adsorption behavior even for the same nominal solution.
06 · Initial load
Adsorption can begin while the drop is still being formed
Profile-analysis experiments also have an initial-load problem. During dosing of the drop, adsorption can begin immediately.
The first image acquired after the target drop volume is reached therefore does not necessarily correspond to Γ = 0. The effect is strongest for rapidly adsorbing surfactants and high concentrations.
To consider the initial load Γ(0), the Ward–Tordai equation can be modified accordingly.
Ward–Tordai equation with initial load
A mechanistic model can include Γ(0) as an initial condition. Alternatively, the formation protocol can be made reproducible and the earliest data interpreted as the state after a defined preparation interval rather than as a perfectly clean surface.
07 · Complementary methods
Profile analysis extends dynamic measurements toward longer interfacial ages
Bubble pressure and profile analysis complement one another. Bubble pressure resolves the earliest adsorption stages; profile analysis extends the same system to longer times.
When both techniques are applied to the same surfactant concentration series, a dynamic curve can be constructed across several orders of magnitude in interfacial age.
The scientific value lies not merely in increasing the number of data points. Agreement across methods tests whether a single kinetic and thermodynamic model can describe both short- and long-time adsorption.
Disagreement can also be informative. Possible explanations include impurity adsorption, differences in initial load, finite-drop depletion, hydrodynamic corrections or inconsistent definitions of interfacial age.
09 · References
Scientific literature
- 1.D. Möbius and R. Miller (Eds.), Drops and Bubbles in Interfacial Research, Studies in Interface Science, Vol. 6, Elsevier, Amsterdam, 1998.
- 2.T. Kairaliyeva, E. V. Aksenenko, N. Mucic, A. V. Makievski, V. B. Fainerman and R. Miller, Surface Tension and Adsorption Studies by Drop Profile Analysis Tensiometry, Journal of Surfactants and Detergents 20 (2017) 1225–1241. DOI: 10.1007/s11743-017-2016-y.
- 3.M. Ferrari, L. Liggieri, F. Ravera, C. Amodio and R. Miller, Adsorption kinetics of alkyl phosphine oxides at the water/hexane interface. 1. Pendant drop experiments, Journal of Colloid and Interface Science 186 (1997) 40–45.
- 4.V. B. Fainerman, D. Möbius and R. Miller (Eds.), Surfactants: Chemistry, Interfacial Properties, Applications, Studies in Interface Science, Vol. 13, Elsevier, Amsterdam, 2001.